U.S. Drought Extent
Share of the contiguous United States in severe drought or worse (categories D2 through D4).
23.0%
of the contiguous U.S. in severe drought or worse (D2–D4)
Reported by the U.S. Drought Monitor
−8.5 percentage points over four weeks
Through Nov 3, 2026 · published Nov 5, 2026
Current map
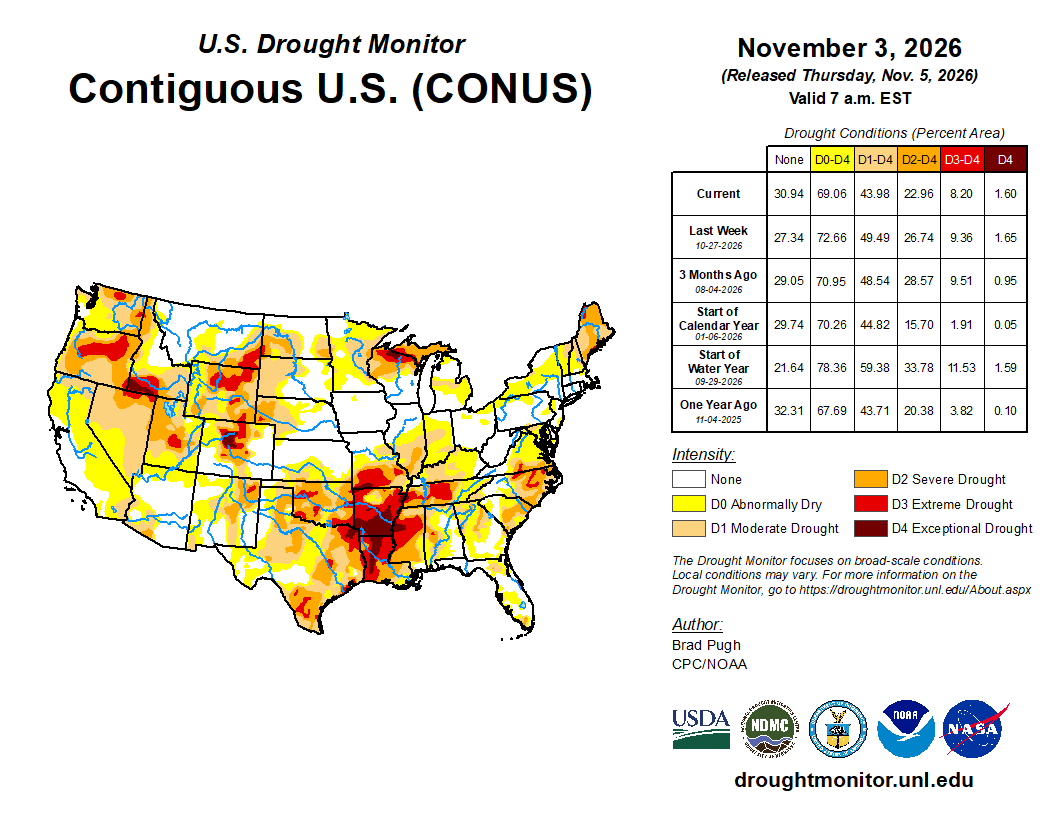
Where it is concentrated
| State | Share of state in D2–D4 |
|---|---|
| Arkansas | 91.3% |
| Louisiana | 78.7% |
| Mississippi | 74.2% |
| Oklahoma | 66.3% |
| Maine | 60.1% |
| Tennessee | 58.5% |
| Oregon | 57.6% |
| Wyoming | 50.6% |
Historical trend
By drought category
| Category | Share of area |
|---|---|
| No drought or dryness | 30.9% |
| D0 Abnormally dry | 25.1% |
| D1 Moderate drought | 21.0% |
| D2 Severe drought | 14.8% |
| D3 Extreme drought | 6.6% |
| D4 Exceptional drought | 1.6% |
What this measures
The U.S. Drought Monitor classifies drought weekly from D0 (abnormally dry) to D4 (exceptional). This indicator uses the cumulative D2–D4 share of land area, and the geographic scope is the contiguous United States: Alaska, Hawaii and the territories are excluded.
Sources and schedule
Weekly on Thursday, reflecting conditions through the preceding Tuesday.
Watch the weak points
The most interesting systemic risks, emerging threats, and surprising connections.
Signups open soon.